
| Source | How it is supplied | 2025 volume (KL) | Share of total (%) |
|---|---|---|---|
| CRDA supply | Raw water supplied through CRDA from the Krishna River into the campus storage | 59,181 | 11.4 |
| Kondavity Vagu | Water drawn from the Kondavity Vagu stream, metered at the intake | 95,934 | 18.5 |
| River pumps to the CRDA sump | Two pumps that transfer river water to the CRDA sump (5 HP, and 15 HP from August) | 177,535 | 34.3 |
| Tanker water | Water received by tanker at Phase 1 and Phase 2 | 184,661 | 35.7 |
| Total received | 517,311 | 100 | |
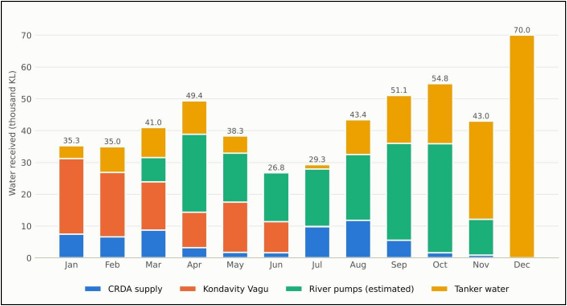
Image 1: Water received each month in 2025 by source (thousand KL)
The monthly record shows how the sources were used through the year. The Kondavity Vagu was the main source in January and February (23,718 KL and 20,223 KL); its use fell through the year to 127 KL in July and it was not drawn after that, so the campus relied more on the CRDA supply and the river pumps. The river pumps were first used in March (7,697 KL), supplied the largest share of source water in April and from June to October, and peaked at 34,200 KL in October. The CRDA supply was highest in August (11,809 KL). Total receipts were lowest in June (26,765 KL) and July (29,336 KL), the semester-end break when students are away, and highest in October (54,790 KL) and December (70,007 KL). In November and December the campus was supplied mainly by tanker water, 30,902 KL and 70,007 KL respectively.
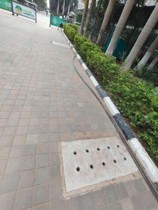
Image 3: Walkway with a pit cover beside a planted bed
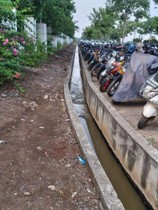
Image 4: Concrete channel carrying surface run-off