Home About Us Sustainability SDG6 – Clean Water and Sanitation Sustainable Water Extraction on Campus

OVERVIEW

Sustainable Water Extraction on Campus

SRM University-AP records every source of water it takes onto the campus. Meter readings are taken at each source every day, compiled into monthly records and summarised for the year. In the calendar year 2025 the campus received 517,311 kilolitres (KL) of water, an average of 1,417 KL a day. Of this, 332,650 KL (64.3 per cent) was drawn from three sources, the CRDA supply, the Kondavity Vagu stream and river pumps feeding the CRDA sump, and 184,661 KL (35.7 per cent) was brought in by tanker. The university also treats its wastewater and reuses it, so that part of its demand is met without any fresh extraction: 143,535 KL of treated wastewater was reused in 2025, equal to about 28 per cent of the water received.

517,311 KL

Water received in 2025

1,417 KL

Average received per day

64.3%

From CRDA, stream and river pumps

28%

Of receipts met by reuse

SOURCES

Sources of Campus Water

The campus draws on several sources, and the quantity taken from each is recorded separately so that the dependence on any one source can be seen and managed.
Source How it is supplied 2025 volume (KL) Share of total (%)
CRDA supply Raw water supplied through CRDA from the Krishna River into the campus storage 59,181 11.4
Kondavity Vagu Water drawn from the Kondavity Vagu stream, metered at the intake 95,934 18.5
River pumps to the CRDA sump Two pumps that transfer river water to the CRDA sump (5 HP, and 15 HP from August) 177,535 34.3
Tanker water Water received by tanker at Phase 1 and Phase 2 184,661 35.7
Total received 517,311 100

MEASUREMENT

How Extraction Is Measured

The opening and closing readings of the CRDA and Kondavity Vagu meters are recorded every day, and the daily intake is worked out from the difference. The two river pumps transfer water directly to the CRDA sump without a meter, so their daily quantity is estimated from the running hours of the pumps, which are logged every day; this source was used from March to November. Tanker water is recorded at each delivery, for Phase 1 and Phase 2 separately up to October and as a single total in November and December. The daily records are then compiled into a monthly sheet and an annual summary of total water received, average daily receipt and tanker share.

2025 RECORD

Water Received in 2025

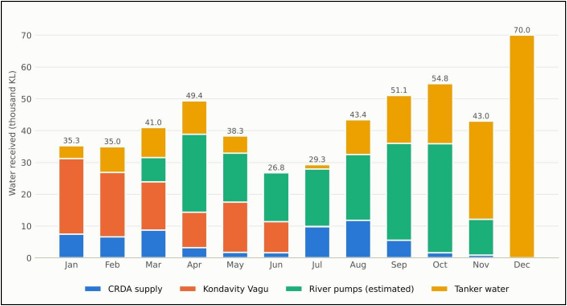
Image 1: Water received each month in 2025 by source (thousand KL)

The monthly record shows how the sources were used through the year. The Kondavity Vagu was the main source in January and February (23,718 KL and 20,223 KL); its use fell through the year to 127 KL in July and it was not drawn after that, so the campus relied more on the CRDA supply and the river pumps. The river pumps were first used in March (7,697 KL), supplied the largest share of source water in April and from June to October, and peaked at 34,200 KL in October. The CRDA supply was highest in August (11,809 KL). Total receipts were lowest in June (26,765 KL) and July (29,336 KL), the semester-end break when students are away, and highest in October (54,790 KL) and December (70,007 KL). In November and December the campus was supplied mainly by tanker water, 30,902 KL and 70,007 KL respectively.
DEMAND

Reducing the Demand on Water Sources

Every kilolitre saved or reused is a kilolitre that does not have to be drawn from a river, stream or tanker, and the university cuts its demand in several ways. The four sewage treatment plants treat domestic wastewater, and 143,535 KL of treated water was reused in 2025 for toilet flushing (75 per cent), cooling (20 per cent) and gardening (5 per cent). All 4,059 taps on campus are low-flow, and 457 of the 486 washrooms (94 per cent) have dual-flush toilets with a 4-litre half flush and an 8-litre full flush. In the landscape, 67.8 per cent of the 34,577 plants and trees recorded are drought tolerant or moderately so, beds are watered by drip irrigation, lawns are limited and tree basins are mulched. The campus also has no overhead tanks, which removes overflow and leakage losses, and signage at drinking water points asks users to refill their bottles, close the tap fully and take only what they need.

RAINWATER

Rainwater Harvesting

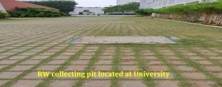
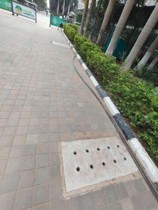
Alongside the sources it draws on, the campus puts rain that falls on it back into the ground. Rainwater is treated as a resource in building design: roofs are arranged to collect rainwater, which passes through a piping system to harvesting pits close to each building, where it recharges groundwater. The campus has 11 rainwater harvesting systems with a combined capacity of 22 m³. Run-off from common areas and roads is collected and routed to a nearby water body, and some paved areas are laid with grass joints that let rain soak into the ground. Keeping rain in the local water cycle helps to replenish the groundwater around the campus and supports the sources the university relies on.
Image 2: Rainwater collecting pit in the grass-paved area

Image 3: Walkway with a pit cover beside a planted bed
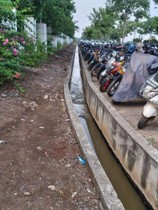
Image 4: Concrete channel carrying surface run-off

MANAGEMENT

Monitoring and Responsible Management

Because every source is recorded every day, the university can see how its dependence on each source changes through the year and plan its supply accordingly. The monthly records show the effect of the academic calendar on demand, with receipts at their lowest in June and July and rising when students return. The same records give the baseline against which the effect of the reuse and water-saving measures can be measured in the years ahead, and they let the quantities taken from river and stream sources be kept under review as water availability changes through the year.

REPORT

Supporting Report

Report: 6.5.4 Sustainable Water Extraction on Campus